How Fast Do Solar Panels Degrade Over Time?
See what solar panel degradation does to output at 10, 20 and 25 years, what a performance warranty actually covers, and when a drop is not normal aging.
- NREL's research puts crystalline silicon degradation at a median of 0.5–0.6% a year, though the mean is higher (0.8–0.9%) because some systems degrade faster.
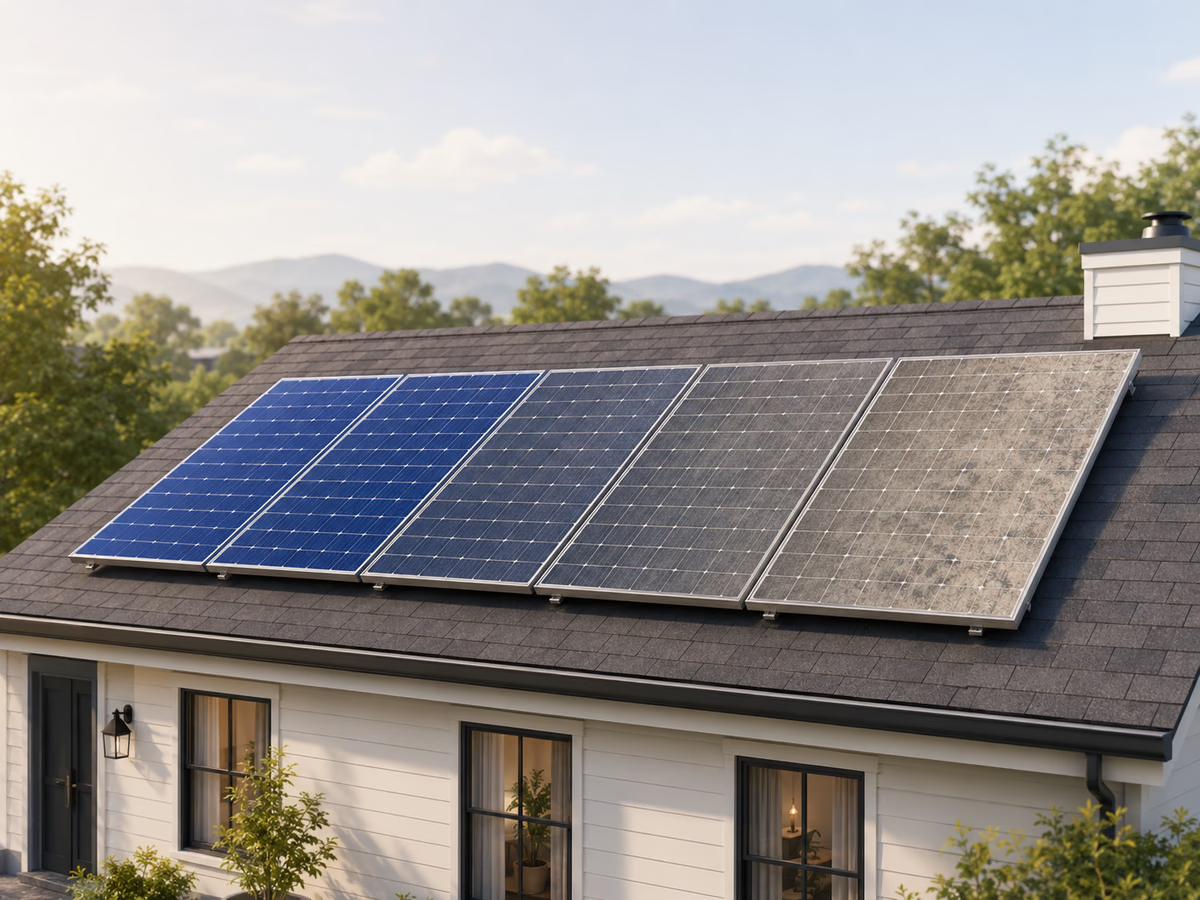
- Compounded at 0.6%/year, a system holds about 94% of first-year output after 10 years, 89% after 20, and 86% after 25.
- Modules are typically warrantied for 20–25 years but keep producing after that, with no fixed end to their productive life.
- A performance warranty covers module power under a lab test, not the kWh your roof actually produces in a given year.
- A sudden double-digit production drop is almost never normal aging — it's a fault, like an inverter issue or new shading, worth diagnosing.
On this page
- How fast do solar panels degrade?
- What a degradation rate means in practice
- Output after 10, 20 and 25 years
- What degradation does to solar savings
- Performance warranty is not production
- Why production can fall faster than the panels age
- How to tell normal aging from a real problem
- Does degradation change solar payback?
- What to do next
Solar quotes tend to carry a single degradation number, usually half a percent a year, presented as if it were a property of physics. It is closer to a summary statistic from a large and uneven body of field research, and the distribution behind it matters as much as the headline.
How fast do solar panels degrade?
The reference work is NREL's Compendium of Photovoltaic Degradation Rates, published in Progress in Photovoltaics in 2016. It aggregated more than 11,000 degradation rates from roughly 200 studies across 40 countries. For crystalline silicon it reports a median in the 0.5% to 0.6% per year range and a mean in the 0.8% to 0.9% range. HIT and microcrystalline silicon land nearer 1% a year, behaving more like thin-film products.
That gap between median and mean is the part usually left out. A mean well above the median means the distribution has a long tail: most systems cluster near the median, and a minority degrade considerably faster and drag the average up. Quoting 0.5% as the expected outcome is defensible; quoting it as a ceiling is not.
The earlier Jordan and Kurtz analytical review, published in 2013 from around 2,000 rates spanning 40 years of field testing, put the median at 0.5% a year and remains the source most consumer material is echoing. Both works aggregate published studies rather than sampling American rooftops at random, and their authors flag bias related to system size and measurement accuracy. Separately, NREL reported in 2017 that systems installed after 2000 showed fewer failures and different degradation modes than older ones, so an older median may understate how modern hardware behaves.
What a degradation rate means in practice
Two methods circulate, and they do not give the same answer. Keep them apart.
- Linear remaining output = 1 − (degradation rate × years). Simple, and the form many warranty schedules resemble.
- Compounded remaining output = (1 − degradation rate)^years. Each year's loss applies to what is left, not to the original figure.
- Future annual production = first-year production × remaining output factor.
- Annual energy loss = first-year production − future annual production. Annual value = future annual production × value per kWh.
At the same rate, the compounded method always leaves more than the linear one, because the percentage bites into a shrinking base. Over 25 years at 0.6% the difference is about one percentage point; at 1.0% it widens to nearly three. Throughout this guide the factor (1 − r)^N describes output once N full years have passed, so the first year carries no degradation at all.
Output after 10, 20 and 25 years
| Rate/yr | 10 yr | 20 yr | 25 yr | 25 yr linear | What it represents |
|---|---|---|---|---|---|
| 0.5% | 95.1% | 90.5% | 88.2% | 87.5% | Median, x-Si (low end) |
| 0.6% | 94.2% | 88.7% | 86.0% | 85.0% | Median, x-Si (high end) |
| 0.9% | 91.4% | 83.5% | 79.8% | 77.5% | Mean, x-Si (high end) |
| 1.0% | 90.4% | 81.8% | 77.8% | 75.0% | HIT / microcrystalline |
| 0.5%/yr — median low | 88.2 % of first-year production | |
|---|---|---|
| 0.6%/yr — median high | 86 % of first-year production | |
| 0.9%/yr — mean high | 79.8 % of first-year production | |
| 1.0%/yr — HIT / µc-Si | 77.8 % of first-year production |
Compounded. Module-level expectation, not a production guarantee. NREL Compendium of Photovoltaic Degradation Rates (2016)
What degradation does to solar savings
Performance warranty is not production
Two separate documents usually come with a module, and conflating them causes most of the disappointment in this area.
| Product warranty | Performance warranty | |
|---|---|---|
| Covers | Manufacturing defects and workmanship | Module power staying above a threshold |
| Measured how | Physical failure or defect | A defined test procedure, with tolerances |
| Typical term | Shorter than the performance term | Commonly 20 to 25 years |
| Does not cover | Normal power decline | Your roof's annual kWh |
| Usually excluded | Labor, removal, shipping | Inverter, shading, soiling, outages, lost revenue |
A performance warranty promises that a module, tested a particular way, will still make a stated fraction of its rated power at a given year. It says nothing about how many kilowatt-hours your array delivers, because that depends on weather, shading, soiling, availability and the inverter — none of which the module maker controls. Claims typically require proof of ownership, serial numbers, measurement by the specified method, and sometimes inspection by an approved installer, and the costs of removing, shipping and reinstalling a module are often not included.
NREL frames the end of the term plainly: modules are typically warrantied for 20 to 25 years, after which they can still produce electricity but the output is no longer guaranteed, and there are no end-dates as such for productive life. Well-built modules have demonstrated performance for 30 years outdoors.
Why production can fall faster than the panels age
Slow annual degradation cannot produce a step change. If output drops noticeably between one month and the equivalent month a year earlier, the cause is almost certainly something else.
| Pattern | Likely cause | Normal aging? | First check |
|---|---|---|---|
| Sudden drop to zero | Inverter fault or outage | No | Monitoring alerts |
| One string or area down | String or microinverter fault | No | Per-string data |
| Step drop, stays low | New shading or hardware fault | No | What changed nearby |
| Gradual seasonal dip | Vegetation growing back | No | Ground-level view at noon |
| Dusty spell, then recovery | Soiling, then rain | No | Rainfall since the dip |
| Whole summer weaker | Cloud, smoke or heat | No | Local irradiance data |
| A few tenths of a % a year | Module degradation | Yes | Multi-year comparison |
Weather is the reason a single weak month proves nothing. Irradiance varies year to year, high cell temperatures reduce output, and smoke, snow and cloud all cut production without anything being wrong. Comparing raw totals from two different years mixes those effects with degradation. Weather normalization — adjusting measured output for the sunlight and temperature actually experienced — is what separates the two, and it needs several years of data before a trend of a few tenths of a percent is visible at all.
How to tell normal aging from a real problem
- Compare like with like: the same month against the same month in earlier years, not against last month.
- Normalize for weather as far as your data allows, or at least note unusual cloud, smoke, snow or heat before drawing conclusions.
- Read the monitoring alerts. Most step changes are already flagged there.
- Compare strings or microinverters against each other. One area behaving differently is diagnostic.
- Look from the ground for new shade — a grown tree, a neighbor's addition, a new antenna — around midday.
- Call the installer if the drop is abrupt, persistent, or confined to part of the array. That is a service call, not a maintenance task.
Does degradation change solar payback?
It lengthens it, modestly. Annual value = future annual production × value per kWh, and a system delivering 94% of first-year output in its eleventh year is delivering 94% of the savings too. Over a payback period measured in years rather than decades, a few tenths of a percent compounding has limited room to act.
What moves payback more is everything degradation is often blamed for: the value of a kWh where you live, whether excess generation is credited at retail or wholesale, how much you consume on site, an inverter replacement partway through, and financing. If your quote assumed a degradation rate at the low end of the published range, it is worth re-running it at the mean instead and seeing whether the case still holds. If it only works at 0.5%, it is a thinner case than it looked.
What to do next
- If production is stable year over year: nothing to do. Note your first-year figure so future comparisons have a baseline.
- If it is drifting down by a few tenths of a percent a year: that is consistent with normal module aging.
- If it dropped abruptly: check monitoring alerts and per-string data, then contact the installer. Do not investigate the hardware yourself.
- If you are near a warranty threshold: read the schedule, the test method and the claim conditions before assuming a claim exists.
- If the system is old but working: production at 20 years is typically still around 88% to 90%, which rarely justifies replacement on energy grounds alone.
Sources
- Compendium of Photovoltaic Degradation Rates (Jordan, Kurtz, VanSant et al.; Progress in Photovoltaics 2016, 24(7):978–989) — National Renewable Energy Laboratory. Consulted August 2, 2026.
- Photovoltaic Degradation Rates — An Analytical Review (Jordan & Kurtz; Progress in Photovoltaics 2013, 21(1):12–29) — National Renewable Energy Laboratory. Consulted August 2, 2026.
- STAT FAQs Part 2: Lifetime of PV Panels (warranty period versus productive life) — National Renewable Energy Laboratory. Consulted August 2, 2026.
- Researchers at NREL Find Fewer Failures of PV Panels and Different Degradation Modes in Systems Installed after 2000 (2017) — National Renewable Energy Laboratory. Consulted August 2, 2026.
- Electric Power Monthly, Table 5.6.A — average residential price by state — U.S. Energy Information Administration. Consulted August 1, 2026.
Frequently asked questions
How much do solar panels degrade each year?
NREL's 2016 compendium of more than 11,000 published rates puts crystalline silicon at a median of 0.5% to 0.6% a year, with a mean of 0.8% to 0.9%. The gap matters: the mean sits above the median because a minority of systems degrade much faster, so 0.5% is a central figure rather than a typical ceiling. HIT and microcrystalline silicon come in nearer 1% a year.
How much power do solar panels produce after 25 years?
At 0.5% a year compounded, about 88% of first-year output. At 0.6%, about 86%. At 0.9%, about 80%. Those are module-level expectations under stable conditions — actual production also depends on the inverter, shading, soiling and the weather in any given year.
Do solar panels stop working after 25 years?
No. NREL states that modules are typically warrantied for 20 to 25 years and can still produce electricity afterwards, with the level of output simply no longer guaranteed, and that there are no end-dates as such for productive life. Well-built modules have shown performance for 30 years outdoors. The warranty expiring is a contractual event, not a mechanical one.
What does a solar performance warranty cover?
It promises that module power, measured under a defined test procedure and within stated tolerances, will stay above a threshold on a set schedule. It does not promise how many kWh your roof will generate in a given year, and it typically excludes the inverter, labor, removal, shipping, lost revenue, shading and soiling. Read the schedule and the claim conditions rather than the headline percentage.
Why did my solar production suddenly drop?
Slow annual degradation cannot produce a sudden drop. A step change points to something specific: an inverter fault, a failed string or microinverter, new shading from vegetation or construction, heavy soiling or snow, a grid outage, or a monitoring problem that is misreporting rather than mis-producing. Check the monitoring alerts first, then call the installer.
Should I replace 20-year-old solar panels?
Not on age alone. A system holding around 88% to 90% of its original output is still doing most of its job, and replacement costs include removal and reinstallation on top of new hardware. The case strengthens when roof space is tight and newer modules would fit more capacity in the same area, when the roof needs work anyway, or when modules have actually failed rather than aged.
Does the inverter affect solar panel degradation?
It does not change how the modules age, but it changes what you measure. Module degradation is gradual and small; an inverter fault is abrupt and large. Because production monitoring usually sits downstream of the inverter, an inverter problem shows up as a production loss that has nothing to do with the panels.